Просмотр новости
Найдите то, что Вас интересует
 Спутники
 РН
РН SpaceX
 Роскосмос
 NASA
NASA
СпутникиРНSpaceXРоскосмосNASA
The National Hurricane Center is proposing updates to its tropical cyclone “cone of uncertainty” forecast graphic across the Atlantic and Pacific basins.
The proposed changes focus on improving how a storm’s track forecast is communicated and how the public interprets forecast confidence.
The NHC’s forecast cone — likely its most recognized graphic — is often misunderstood as depicting impact areas rather than forecast uncertainty.
This season’s experimental offering aims to close that gap and increase user understanding.
The National Hurricane Center is proposing updates to its tropical cyclone “cone of uncertainty” forecast graphic across the Atlantic and Pacific basins.
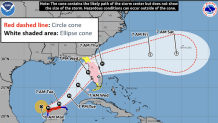
At the core of the experimental graphic rollout: framing what the cone represents. The current cone is based on a 67% confidence interval. Meaning that, historically, the storm’s center remains within the cone about two-thirds of the time.
The proposed shift increases that confidence level to 90%, reflecting a broader and more realistic range of possible track outcomes. The system’s forward speed can be better accounted for in the proposed graphic as well.
In practical terms, users will see a cone that encompasses a slightly larger area in terms of, both, width and length. The expectation is an illustration of the full envelope of a storm’s potential track rather than a narrower, but lower confidence, path.
This distinction is critical for effective communication. A cone with a confidence level of 2/3rds can unintentionally convey a false sense of precision, leading users to assume that areas outside the cone are not at risk. In recent memory, this proved a significant concern for Southwest Florida preparing for Hurricane Ian in 2022.
Expanding to a 90% confidence level better aligns the graphic to more realistic outcomes, reinforcing that hazardous conditions can, and often do, occur outside traditional cone boundaries.
This change also follows the NHC’s broader effort to simplify and strengthen messaging, including the addition of inland watches and warnings for approaching tropical systems.
The experimental tropical cyclone forecast cone graphic will be produced and published shortly after the current operational cone during each forecast cycle of the 2026 season.
The National Hurricane Center is proposing updates to its tropical cyclone "cone of uncertainty" forecast graphic across the Atlantic and Pacific basins.
The proposed changes focus on improving how a storm’s track forecast is communicated and how the public interprets forecast confidence.
The NHC’s forecast cone — likely its most recognized graphic — is often misunderstood as depicting impact areas rather than forecast uncertainty.
This season’s experimental offering aims to close that gap and increase user understanding.
National Hurricane Center
The National Hurricane Center is proposing updates to its tropical cyclone "cone of uncertainty" forecast graphic across the Atlantic and Pacific basins.
At the core of the experimental graphic rollout: framing what the cone represents. The current cone is based on a 67% confidence interval. Meaning that, historically, the storm’s center remains within the cone about two-thirds of the time.
The proposed shift increases that confidence level to 90%, reflecting a broader and more realistic range of possible track outcomes. The system’s forward speed can be better accounted for in the proposed graphic as well.
The NBC 6 First Alert Weather team guides you through hurricane season

In practical terms, users will see a cone that encompasses a slightly larger area in terms of, both, width and length. The expectation is an illustration of the full envelope of a storm’s potential track rather than a narrower, but lower confidence, path.
This distinction is critical for effective communication. A cone with a confidence level of 2/3rds can unintentionally convey a false sense of precision, leading users to assume that areas outside the cone are not at risk. In recent memory, this proved a significant concern for Southwest Florida preparing for Hurricane Ian in 2022.
Expanding to a 90% confidence level better aligns the graphic to more realistic outcomes, reinforcing that hazardous conditions can, and often do, occur outside traditional cone boundaries.
This change also follows the NHC’s broader effort to simplify and strengthen messaging, including the addition of inland watches and warnings for approaching tropical systems.
The experimental tropical cyclone forecast cone graphic will be produced and published shortly after the current operational cone during each forecast cycle of the 2026 season.
| # | Наименование новости | Тональность | Информативность | Дата публикации |
|---|---|---|---|---|
| 1 | National Hurricane Center focuses on Central Atlantic for possible development | 0 | 6.38 | 10-08-2026 |
| 2 | CSU's updated hurricane season forecast calls for fewer storms in 2026 | 0 | 19.02 | 10-06-2026 |
| 3 | Forecasters watching potential tropical system in the Gulf | 0 | 10.87 | 15-07-2026 |
| 4 | It's the start of hurricane season: What to expect | 0 | 15.23 | 01-06-2026 |
| 5 | Tropical Storm Cristobal forms, as forecasters eye 2 other potential systems | 0 | 16 | 12-08-2026 |
| 6 | Atlantic hurricane season ramps up: What South Florida residents need to know | 0 | 7.3 | 09-08-2026 |
| 7 | Hurricane Season: July has produced impactful storms but 2026 won't support it | 0 | 6.38 | 07-07-2026 |
| 8 | Hurricane Season 2026: NBC6's guide for South Florida residents | 0 | 11.9 | 01-06-2026 |
| 9 | El Niño locks in, with impacts to hurricane season and South Florida weather likely | 0 | 6.06 | 10-07-2026 |