Просмотр новости
Найдите то, что Вас интересует
 Спутники
 РН
РН SpaceX
 Роскосмос
 NASA
NASA
СпутникиРНSpaceXРоскосмосNASAThe European summer of 2026 has so far been characterised by exceptional heat and widespread dryness (Copernicus, 2026). Between April and June, large parts of the continent, from Portugal in the southwest to southern Finland in the northeast, received below-average rainfall. Combined with successive heatwaves, these conditions have intensified drought across Europe, contributing to widespread … Continue reading "Increasingly hot Europe faces more severe droughts and growing challenges for water and land management"
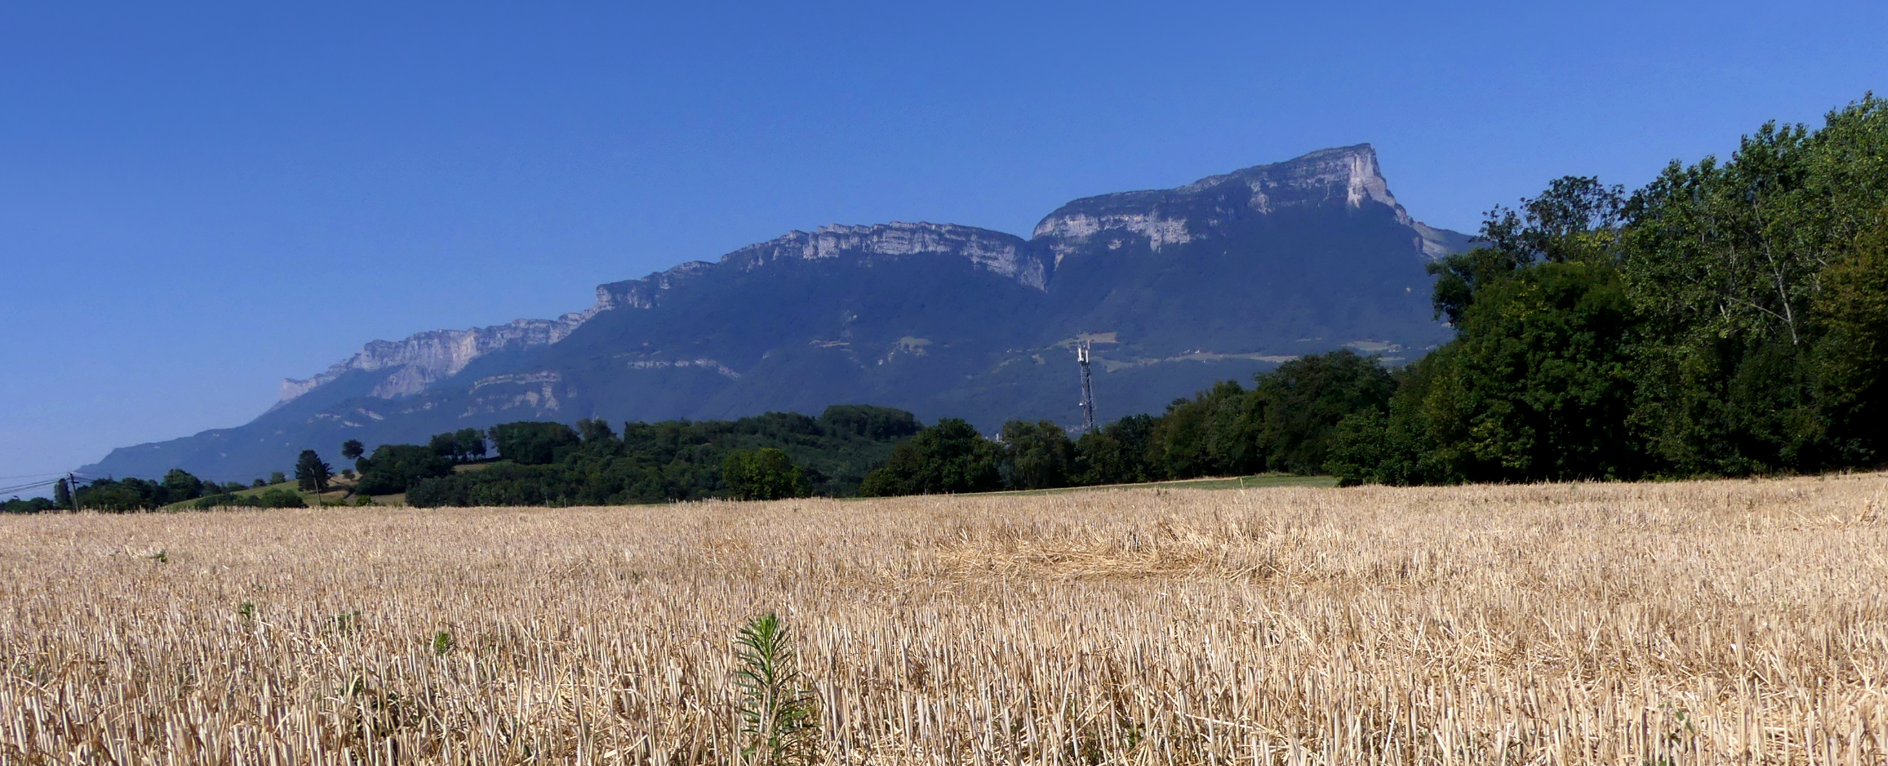 Dry fields near La Chavanne and Sainte-Hélène-du-Lac, in Savoie, France on 8 July 2026. Photo: Florian Pépellin License: https://creativecommons.org/licenses/by-sa/4.0/
The European summer of 2026 has so far been characterised by exceptional heat and widespread dryness (Copernicus, 2026). Between April and June, large parts of the continent, from Portugal in the southwest to southern Finland in the northeast, received below-average rainfall. Combined with successive heatwaves, these conditions have intensified drought across Europe, contributing to widespread agricultural and hydrological impacts, unusually low river levels (NOS, 2026), and severe wildfires, particularly in Spain and France, where 116,000 and 42,000 hectares have already been burnt, respectively (EFFIS, 2026). Although western Europe experienced a relatively wet start to the year, persistent precipitation deficits in eastern Europe carried over from 2025, resulting in different types and stages of drought developing across the continent. With forecasts indicating little relief in the near term, the summer of 2026 is emerging as one of Europe’s most significant heat and drought events in recent years.
Scientists from Austria, Germany, Hungary, Latvia, the Netherlands, Romania, Slovenia, Spain, Sweden, Switzerland, the Czech Republic, the UK, and the US used established, peer-reviewed methods to assess whether, and to what extent, climate change influenced the European drought.
Drought can be defined in several ways. Meteorological drought is characterised by below average rainfall, whereas agricultural drought occurs when lack of rainfall or dry soil affects farming and crop growth and is measured by soil moisture or by estimating the balance between rainfall and evapotranspiration over time. Because increased evapotranspiration driven by regional warming can substantially intensify drought impacts, we separately assess the contributions of both low rainfall and potential evapotranspiration (PET), as well as soil moisture. As the temporal extent of the drought is quite different in the western part of Europe compared to the East, we look at two different timescales: the 3 month drought in the western region and the 6-12 month drought in the eastern region.
Drought drivers and metrics:
Soil moisture is the primary measure of agricultural or ecological drought (Seneviratne et al., 2021), when a deficit in moisture affects vegetation growth and causes other adverse plant responses. It is driven by the combination of meteorological drought (defined as low precipitation) and high seasonal evaporation and transpiration. As well as being a function of humidity, evaporative demand increases exponentially with temperature (Allen et al., 1998), and is therefore sensitive to global warming.
In addition, potential evapotranspiration (PET) is used to reflect the contribution of atmospheric aridity to drought, in lieu of Actual Evapotranspiration (AET). PET is an atmospheric-driven variable, and reflects the amount of evapotranspiration that would be seen assuming unlimited surface water availability, removing the need to account for aspects including spatially varying vegetation, soil texture and irrigation. Whilst both AET and PET respond strongly to warmer temperatures, the increase in AET is normally more limited than PET. This is due to the saturating effect of evaporative demand on actual evaporation as moisture availability is depleted, while highs in evaporative demand are responsive to stomatal closure – limiting actual transpiration (Grossiord et al., 2020). Climate models do not always capture these complex land-atmosphere feedbacks and vegetation responses accurately, which can lead to differences between real and simulated changes in AET.
In this study we also provide direct information on trends in soil moisture, but as these are also affected by regional hydrological differences, we provide additional information in the form of the precipitation and potential evapotranspiration drivers. The unusually sunny conditions over parts of Europe in spring 2026 likely contributed to the observed soil moisture deficits though enhanced evaporation; we do not assess this contribution separately here.
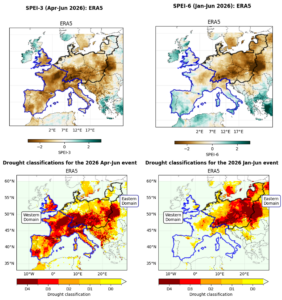
Fig: SPEI maps for 3- and 6- month accumulation periods ending in June 2026 over the region 33-60N,15W-30E. The Western Domain is highlighted in blue and the Eastern Domain is highlighted in black. Bottom: Drought classification maps categorised according to the US Drought Monitor (USDM) system. The categories are based on the n-month SPEI values in June 2026, calculated from ERA5 using the Hargreaves scheme for PET.
[CORRECTION: The SPEI maps for the 3-, 6-, and 12-month accumulation periods have been replaced with corrected versions on the website and the scientific report to correct for an error in the plotting routine. These maps are provided to illustrate the 2026 drought event. All analyses were performed using the correct data; therefore, no results, interpretations, or conclusions in the report are affected.]
Main Findings